- Home .
- Winnipeg Cremations Case Study
Winnipeg Cremations Case Study
In this case study we will outline the results achieved for a Winnipeg based direct cremation business over the course of our engagement. At time of writing we’ve been working with this client for 21 months, however some of the charts used are from a shorter time frame because some of Google’s platforms only store data for a maximum of 18 months.
This campaign has been primarily focused around SEO and Google Ads management. The two charts below are search position ranking charts.
These show the position in Google (on the y axis) over time (x axis) for a specific search term that we are focusing on improving rankings for in Google.


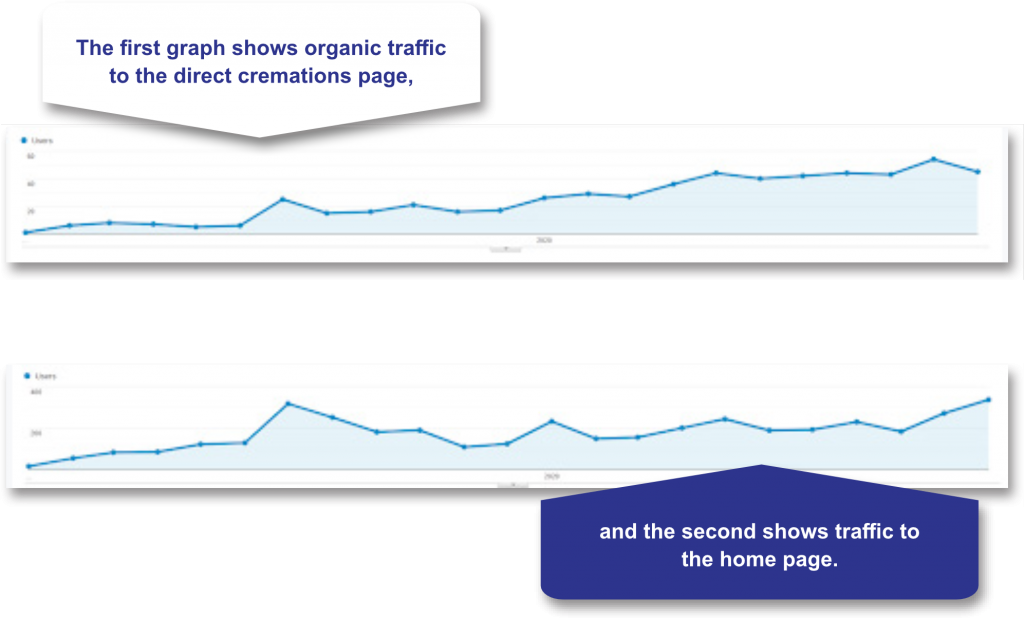
Below are two traffic graphs from Google Analytics over the same time frame.
These charts show the increases in organic traffic resulting from the increased rankings in Google. Note that there are significant improvements in traffic in the first 6 months even before the two main keywords were ranking on page 1.
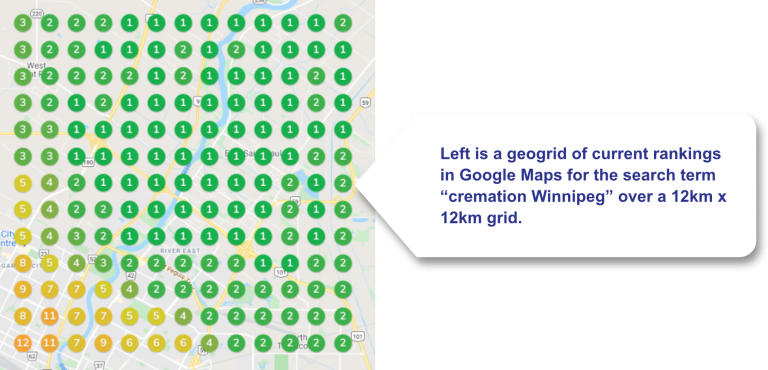
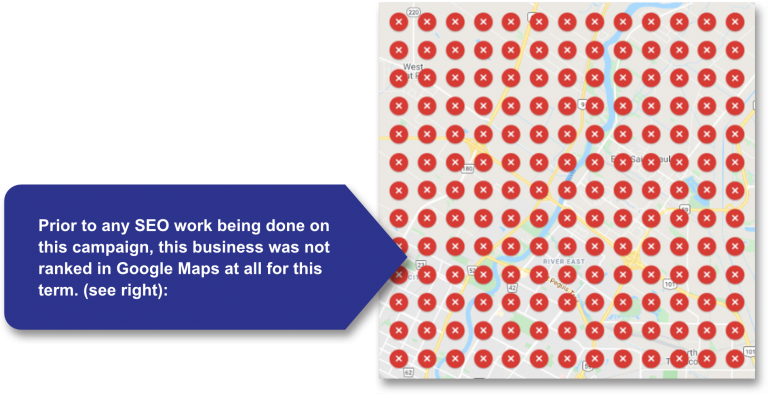
The rankings for Google Maps listings vary significantly from location to location so the most accurate way to track them is on a geogrid on a map.
Below we will discuss what this means in terms of calls and leads generated for the business.
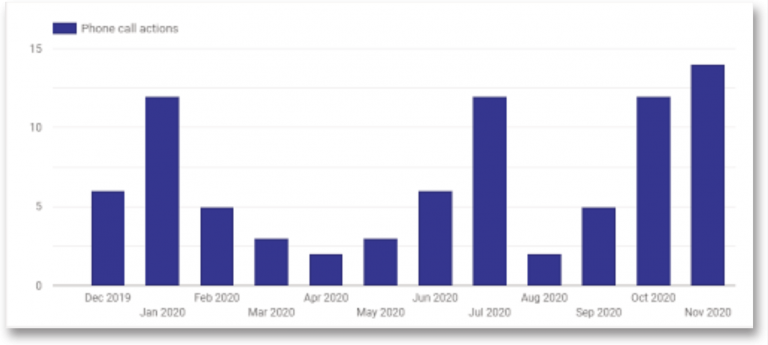
The following chart shows the number of phone calls generated from Google Maps. This is people that type a search into Google, and click the “call” button on the search results page without ever visiting the website.
As you can see this platform generates on average 5-10 calls per month.
It’s worth noting that some of these calls come from people searching specifically for the business name and are not necessarily SEO generated leads.
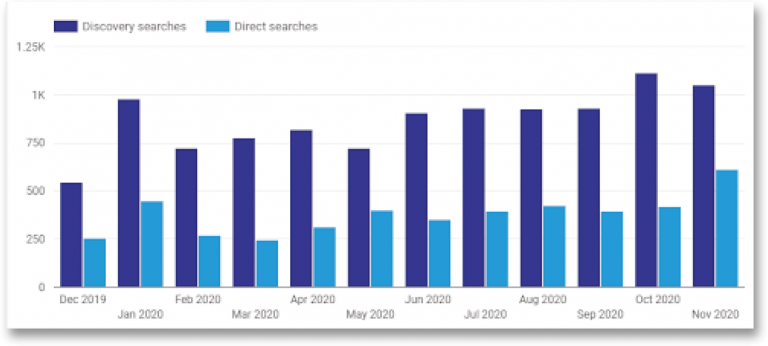
The below chart shows a breakdown over the same month of how many times the Google Map listing was viewed as a result of a direct search (for the business name) and as a result of a discovery search (for a cremation service in this case).
It’s a little bit harder to track the number of calls that come through the website provided that people click on the link to the website, find the phone number and then call. Since we do not have tracking in place for this, we can extrapolate based on other data that we have.
The Google Ads campaign we are running for this client has generated an average of 15 calls per month over the last 3 months.
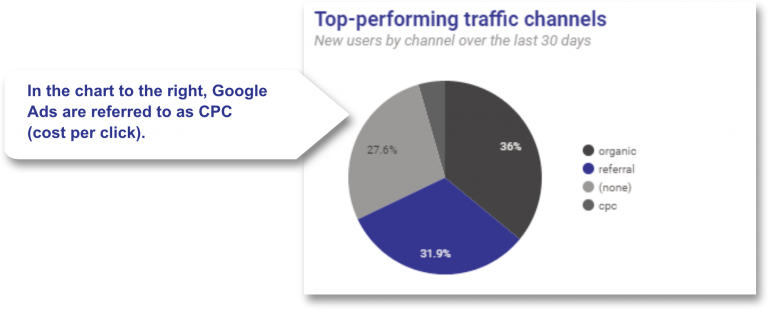
Based on the fact that Google Ads accounts for only about 1/6 of the site traffic that SEO (organic) brings in, and since both traffic sources are targeting the same search terms on the same platform, it seems reasonable to expect that organic traffic would account for significantly more calls than Google Ads. However, since some organic searches my be for more informational terms, let’s conservatively extrapolate that organic leads are equal to leads from Google Ads.
If our (conservative) assumptions are correct, we’re looking at a campaign generating approximately 5-10 calls per month from Google Maps, 15 calls per month from Google Ads, and 15 calls per month from organic traffic for a total of 35-40 additional calls per month.

